
Case study · Fence contractor
Fence Contractor Local SEO Case Study
In five months, a single-location fence contractor in the Fort Worth metro went from invisible across most of its service area to top-three map positions on 59% of a 95-pin grid for its highest-intent keyword, while monthly Business Profile views more than tripled.
Results at a glance
Baseline Against Month Five
The engagement ran from January to May 2026. Every figure comes from the client's own Search Console, Business Profile and geo-grid exports, comparing 1 to 31 January against 1 to 31 May.
| Metric | Baseline | Month five | Change |
|---|---|---|---|
| Business Profile views (monthly) | 309 (Jan 2026) | 1,132 (May 2026) | +823 views, +266% |
| Calls from the Business Profile | 0 (Jan 2026) | 5 (May 2026) | 10 calls across the engagement |
| Geo-grid average rank, "fence rental" | 16.33 (12 Jan 2026) | 4.79 (3 Jun 2026) | 11.54 positions better |
| Grid pins ranking top 3, "fence rental" | 7% of 95 pins | 59% of 95 pins | +52 percentage points |
| Grid pins outside the map pack, "fence rental" | 38% of 95 pins | 0% of 95 pins | eliminated |
| Organic clicks (monthly, Search Console) | 53 (Jan 2026) | 125 (May 2026) | +72 clicks, +136% |
| Organic impressions (monthly) | 4,640 (Jan 2026) | 48,100 (May 2026) | +43,460, +937% |
The work ran alongside the client's own sales activity and normal spring seasonality, so these are results observed after the work shipped rather than isolated causes.
The client
One Yard, Two Revenue Lines
A single-location fence contractor in the southern Fort Worth metro, Texas, running two revenue lines that search very differently: fence installation (wood, cedar, wrought iron, chain link) and temporary fence rental.
Service Area
Roughly a 5 mile trading radius from the yard, covering nine named towns across the southern half of the metro.
Measurement
A 95-pin geo-grid, 1.6 km pin spacing, 5 mile radius, Google Maps on mobile. Identical parameters on every capture from January to June 2026, so every comparison is like for like.
Starting Position
A top-three map position on just 7% of the 95 pins for its strongest keyword, and none for its broader installation terms. On 6 January the rental grid showed the business outside the map pack on 95% of pins. It was not fourth or fifth. It was absent.
The starting situation
Findable By Name, And Almost Nothing Else
Organic search carried 53 clicks a month, and 24 of them came from a single branded query.
| Baseline metric (January 2026) | Value |
|---|---|
| Organic clicks | 53 |
| Organic impressions | 4,640 |
| Organic CTR | 1.1% |
| Average position, all queries | 39.5 |
| Business Profile views | 309 |
| Business Profile interactions | 23 |
| Website clicks from the profile | 23 |
| Calls from the profile | 0 |
| Search terms surfacing the profile | 17 |
| Geo-grid average rank, "fence rental" (12 Jan) | 16.33 |
| Geo-grid average rank, "fence contractor in [city] tx" (6 Jan) | 9.66 |
| Query (January 2026) | Clicks | Impr. | Avg. position |
|---|---|---|---|
| [brand] fence company | 24 | 125 | 2.4 |
| fence installation [metro] | 0 | 193 | 71.2 |
| fence company [metro] | 0 | 183 | 73.6 |
| [metro] fence company | 0 | 163 | 60.2 |
| [metro] fence | 0 | 162 | 71.7 |
| fence companies [metro] | 0 | 154 | 80.4 |
| temporary fencing rental [metro] | 0 | 82 | 31.9 |
| chain link fence contractors | 0 | 81 | 16.5 |
Every commercial non-brand term generated impressions and zero clicks, because none of them ranked on a page a human ever reaches. The business name and city names are redacted as [brand] and [metro].
What the audit found
Four Things Holding The Account Down
The root cause underneath all four: the site and the profile were built around the brand name, and the brand name was the only thing the business ranked for.
1. An Under-Worked Profile
Only 17 search terms surfaced it in a month, and it was producing no calls at all.
2. No City Pages
A contractor selling into eight or nine named towns had nothing on the site for any of them.
3. Pages Built To Look At, Not Convert
No clear conversion path, and thin on-page signals for the service-plus-city terms that matter.
4. No Structured Data
Nothing on the site told Google what the business was, where it operated, or what it sold.
The strategy
Map Pack First, Website Second
For a fence contractor with a yard and a 5 mile radius, the map pack is the shorter path to a phone call. Five bets, in the order they were placed.
1. Profile And Proximity First
Grid rank falls away with distance from the pin, so month one went into profile optimization plus map citations, driving-direction assets and a geo network. It is the lever that moves 95 pins at once.
2. Fix The Money Pages
At 53 clicks a month, more traffic to a home page that does not convert changes nothing. The home page and core service pages were rebuilt for conversion in month one.
3. Eight Small Markets
A city page layer was built two towns at a time from February, so each named town had a page written for it rather than a mention on a generic page.
4. A Constant Authority Rate
50 foundational links and 30 local citations every month, unchanged from January to May. Consistency beats bursts, and a flat rate makes results readable.
5. Schema Once There Was Something To Mark Up
Held to month three, after the pages existed, then implemented across LocalBusiness, FAQPage, Product and ImageObject and validated clean.
Why “Fence Rental”
The lead grid target converts fastest, repeats, and faces a weaker local field than installation, which was treated as the slower compounding play.
Geo-grid
What Moved On The Map
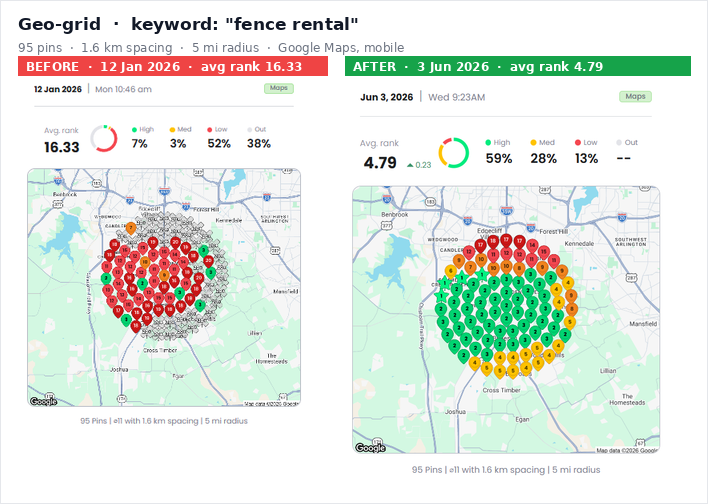
On the lead keyword, average grid rank went from 16.33 to 4.79 and top-three coverage went from 7 pins in a hundred to 59. The 38% of the grid outside the map pack in January was gone by June. Coverage matters more than average rank: a business can hold a decent average and still be invisible across half its territory.
| Keyword | Baseline | Latest | Gain | Coverage change |
|---|---|---|---|---|
| fence rental | 16.33 (12 Jan) | 4.79 (3 Jun) | 11.54 | Top 3: 7% to 59%. Out of pack: 38% to 0% |
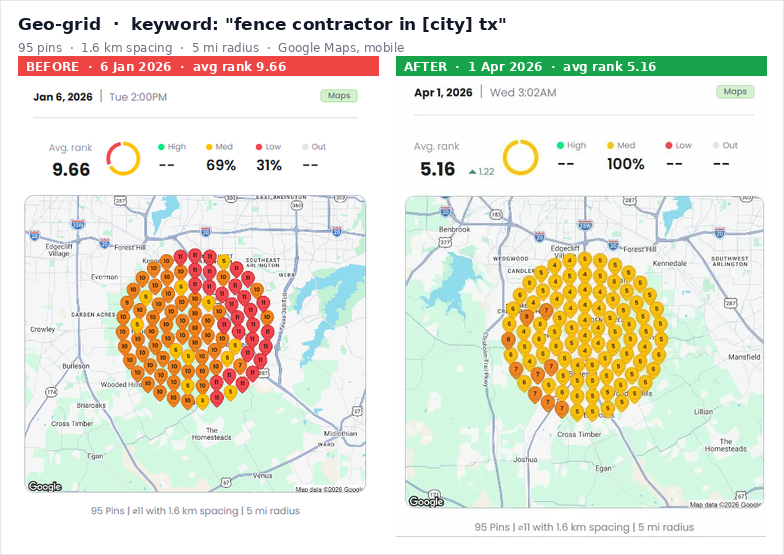
| fence contractor in [city] tx | 9.66 (6 Jan) | 5.16 (1 Apr) | 4.50 | Top 10: 69% to 100% |
| cyclone fence | 14.73 (1 Mar) | 12.51 (1 Apr) | 2.22 | Mid tier: 14% to 39% |
| fence installation near me | 17.57 (1 Mar) | 15.66 (1 Apr) | 1.91 | Low tier shrinking, mid tier growing |
| fence company near me | 17.31 (1 Mar) | 15.72 (1 Apr) | 1.59 | Low tier shrinking, mid tier growing |
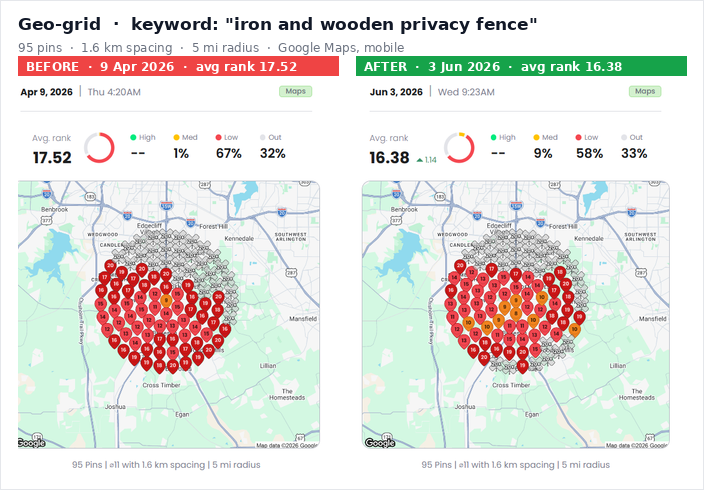
| iron and wooden privacy fence | 17.52 (9 Apr) | 16.38 (3 Jun) | 1.14 | Mid tier: 1% to 9%. Low tier: 67% to 58% |
| fencing contractor | 19.05 (9 Apr) | 18.66 (3 Jun) | 0.39 | Outside top 20: 64% to 58% |
Keywords were added to tracking as the campaign widened, so baseline dates differ by term. Every capture for a given keyword uses the same grid size, spacing, radius and device.
The Lead Keyword, Five Months Apart
The January grid is a small red core with a grey ring: ranking badly near the yard and not ranking at all further out. By June the green centre reaches the edge of the 5 mile radius in every direction except the northern edge, where a band of red pins is still holding.
The City-Intent Keyword
This one never produced a green pin, and that is worth saying plainly. What it did produce was consistency: 100% of the grid inside the top 10 by April, up from 69%, with the red tier eliminated. For a rental-and-installation business, being reliably fourth to sixth everywhere is a better commercial position than being first in one suburb and absent in the next.
The Keyword That Underperformed
Privacy fence installation barely moved: 17.52 to 16.38 in two months, with a third of the grid still outside the map pack. It was added to tracking late, in April, and two months of city pages and links were not enough to shift a term this competitive. It is the honest counterweight to the rental numbers, and it is the work queued first for months six to nine.
Google Business Profile
Views More Than Tripled, Calls Started
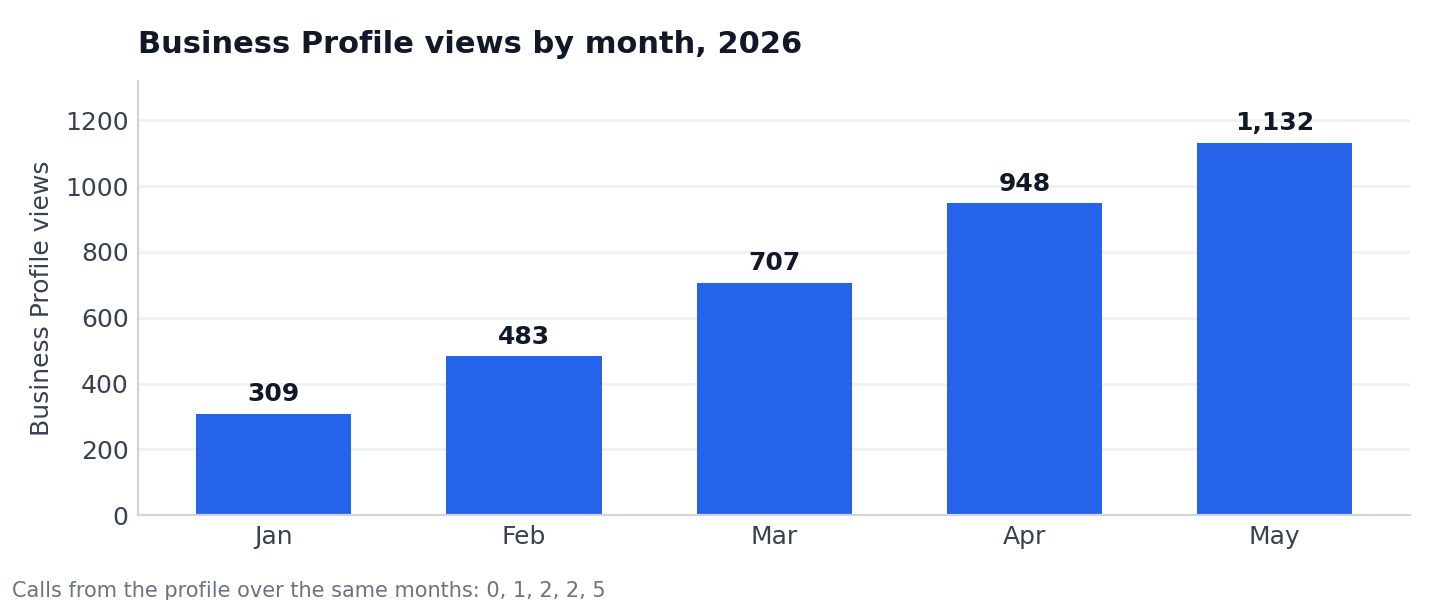
Monthly profile views went from 309 in January to 1,132 in May, and the profile started producing calls it had not produced before.
| Business Profile metric | Jan 2026 | May 2026 | Change |
|---|---|---|---|
| Profile views | 309 | 1,132 | +823, +266% |
| Search terms surfacing the profile | 17 | 36 | +19 terms |
| Calls from the profile | 0 | 5 | 10 across five months |
The Search Terms Changed
In January the term that surfaced the profile most often was the company's own name. By May the most frequent term was “chain link fence”, with the brand second and “cyclone fence” third. The profile stopped being a way for people who knew the business to find it and became a way for people who did not know it to find a fence.
What Did Not Move
Website clicks from the profile stayed flat, 99 in total. Discovery grew almost fourfold and almost none of it passed through to the website. That is normal for a map-led gain, and it is the argument for treating the profile itself as a conversion surface.
Search Console
The Section That Rules Out Seasonality
Average position went from 39.5 to 15.1 and monthly impressions went from 4,640 to 48,100. That is not a busier spring. It is the site becoming eligible for roughly ten times as many queries.
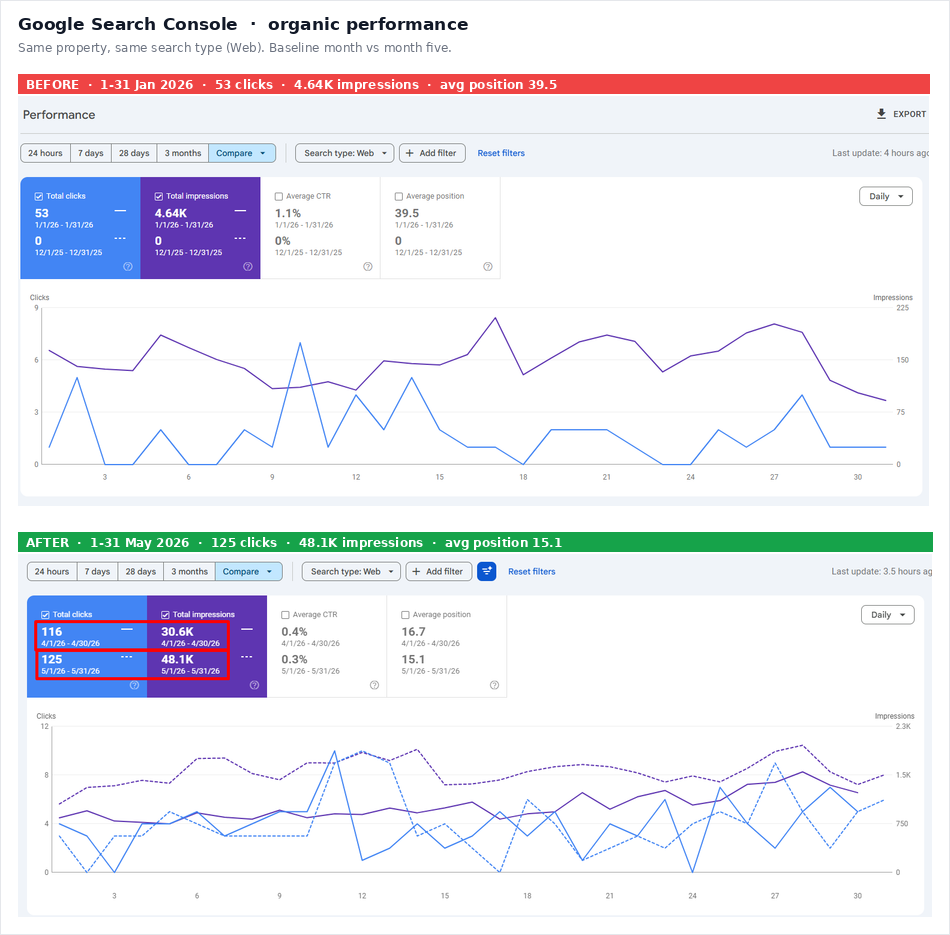
| Month | Clicks | Impressions | CTR | Average position |
|---|---|---|---|---|
| Jan 2026 | 53 | 4,640 | 1.1% | 39.5 |
| Feb 2026 | 72 | 2,580 | 2.8% | 16.6 |
| Mar 2026 | 65 | 11,400 | 0.6% | 17.4 |
| Apr 2026 | 116 | 30,600 | 0.4% | 16.7 |
| May 2026 | 125 | 48,100 | 0.3% | 15.1 |
Read The CTR Honestly
CTR fell from 1.1% to 0.3%. In January the impression base was small and heavily branded, and branded impressions click at a high rate. By May the base was ten times larger and dominated by non-brand terms on page two, which click at almost nothing until they reach page one. Clicks still rose 136%, because a small share of a very large number beats a large share of a tiny one.
February Needs Explaining
Impressions dropped to 2,580 while average position improved from 39.5 to 16.6. Our reading is that the site stopped being surfaced for a long tail of irrelevant queries and started being surfaced for fewer, closer ones. We cannot prove that from Search Console alone, so it is an interpretation, not a finding.
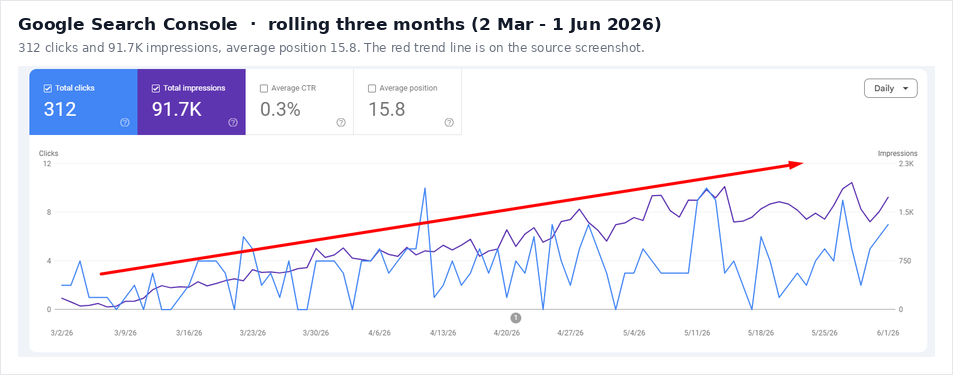
The Three-Month View
Across the rolling three months to 1 June, the property recorded 312 clicks and 91,700 impressions at an average position of 15.8, with both curves rising week on week rather than spiking and falling back.
Query-Level Movement
The clearest single result: in January, every non-brand query in the top ten earned zero clicks. In May, eight of them earned clicks.
| Top query, May 2026 | Clicks | Impressions | Note |
|---|---|---|---|
| [brand] fence company | 74 | 321 | Brand demand, up from 24 clicks in January |
| wrought iron fence cost | 3 | 357 | Absent in January. Follows the April cost blog |
| fence rental | 3 | 119 | The lead grid keyword, now earning organic clicks too |
| fence company | 2 | 478 | Head term, first clicks of the engagement |
| wrought iron fence cost per foot | 2 | 83 | Long-tail sibling of the same blog |
| fence company [metro] | 1 | 900 | 183 impressions and position 73.6 in January |
| [metro] fence contractors | 1 | 627 | New to the top ten |
| [metro] fencing companies | 1 | 476 | New to the top ten |
| metal fence contractors | 1 | 112 | New to the top ten |
The Cost-Content Effect
Two blog posts on fence cost were published in April. By May, “wrought iron fence cost” and its long-tail sibling were the second and fifth highest-click queries on the property, on 440 combined impressions from a standing start. Cost queries are the cheapest commercial intent to win in this trade, because the established players rarely publish prices.
The Head-Term Base
“fence company [metro]” went from 183 impressions at position 73.6 to 900 impressions and a first click. It is still nowhere near page one, but a term that was invisible now has an impression base worth optimizing, which was the point of the city-page layer.
Leads and business impact
What Was Measured, And What Was Not
No call tracking was installed on this account, so there is no verified lead-to-revenue figure, and we are not going to manufacture one.
Form Submissions
The website's enquiry form numbers submissions sequentially. The January report captured submission 83. The May report captured 113 on 5 May and 117 on 14 May. If that counter runs site-wide without resetting, roughly 34 enquiries arrived through the site in the intervening four months. Treat that as an estimate read off a sequence, not a measured figure.
Calls
Alongside the form, the Business Profile produced 10 calls across the five months against zero in January.
The change in what those enquiries asked for is the more useful signal: rental enquiries at the start, installation enquiries with short timelines by month five. Installation is the higher-ticket line, and a three-week timeline is a proxy for a buyer rather than a researcher.
| Enquiry | Captured in January | Captured in May |
|---|---|---|
| Type | Temporary fence rental | Wrought iron installation, and a vinyl or metal installation |
| Scope | 1,260 ft of 6 ft fence with privacy screen | About 200 linear ft with self-closing gates, and 230 linear ft |
| Timeline | Four month hire starting in four months | Installation needed within three weeks |
Next time: call tracking from day one and a lead-source field in the client's CRM, so nobody has to guess how grid rank connects to a signed job.
What actually made the difference
Four Levers Carried It, One Did Not Pay For Itself
1. Profile And Proximity In Month One
The rental grid moved from 20.71 to 6.47 between 6 January and 1 March, before a single city page or blog post was live. Only profile optimization, map citations, driving-direction assets, the geo network and the first foundational links were in flight. That timing is the strongest causal evidence in the account.
2. The City-Page Layer
Its effect shows up in impressions, not rankings. As pages went live two towns at a time, monthly impressions ran 2,580, 11,400, 30,600, then 48,100. City pages did not win those terms. They made the site eligible to compete for them.
3. Cost-Intent Content
Two fence-cost posts published in April were the second and fifth highest-click queries by May, on 440 combined impressions from nothing.
4. A Deliberately Boring Authority Rate
50 foundational links and 30 local citations every month, 250 and 150 across the engagement. Every monthly grid capture improved on the one before. A constant input rate also makes a result readable.
What Underperformed: Schema Markup
Structured data was implemented in March and validated clean at 0 errors and 0 warnings. We expected visible rich results and a CTR lift. Across the two months that followed we could not isolate any effect in Search Console. It remains worth doing as hygiene, but on an account at this stage we would spend that build time on reviews instead.
How the work was done
A Fixed Monthly System, Not Heroics
Every month, regardless of what else was happening: 4 Business Profile posts, offers or events, 50 foundational links, 30 local citations, 5 geo-network Web 2.0 properties and 1 G-stack content update. Everything below sat on top of that baseline.
| Month | Focus | Shipped on top of the baseline |
|---|---|---|
| January | Audit and foundation | Keyword, competitor and geo analysis. Profile and competitor audit. Citations audit. Site quality audit. Profile optimization. Home page and core service pages rebuilt for conversion. Map citations, driving-direction assets, site mirroring. 12 G-stacks, 20 brand profiles, 5 video stacks, 5 podcast stacks. |
| February | Pages and reputation | 2 service pages redesigned, 2 location pages built. Review management started. Image optimization. Competitor monitoring. |
| March | Structure and cost content | 2 city pages. 2 fence-cost blog posts. Schema across LocalBusiness, FAQPage, Product and ImageObject, validated at 0 errors and 0 warnings. 30 brand profiles. Map citations and driving directions refreshed. 2 content marketing assets. |
| April | Service-area expansion | 2 further city pages. 2 further cost blog posts. 10 images optimized. Location-based Web 2.0 build. 2 content marketing assets. |
| May | Service-in-city pages | 2 service-in-city pages (iron fence installation, cedar fence installation). Continued blog publishing. 30 brand profiles. 2 content marketing assets. |
One report a month, with the geo-grid captured on the same keywords, grid size, spacing, radius and device every time. Location pages were built two at a time so each pair could be checked against the grid before the next. The link and citation rate never varied, so when the grid moved we could tell what moved it.
The takeaway
Map Pack First, Content Second
For a service business with a yard and a tight trading radius, the map pack is the cheaper half of local SEO and it moves first. Grid rank on the lead keyword improved by 14 positions in eight weeks on profile and proximity work alone, before a single page or post was published.
If a contractor like this has one quarter of budget, it goes into the Business Profile and its proximity signals, not content. Content is what you buy with the second quarter, once the map pack is already sending calls.
The second lesson is about how to read a grid. Average rank is the number everyone quotes and coverage is the number that pays. This account started with an average of 16.33 and nothing at all on 38% of the map.
FAQ
Fence Case Study Questions
Is this a real client?
Where do the numbers come from?
Does this prove the work caused the results?
What did not work?
Why is the lead keyword "fence rental"?
Can you run a grid audit for my agency's client?
Want This Read On Your Client Account?
If a local client of yours is invisible outside a mile of their own pin, the first deliverable worth paying for is a 95-pin grid on their three highest-intent keywords. We run it white label.